

Over half of Pentagon spending since FY2001 went to the private sector
Over half of Pentagon spending since FY2001 went to the private sector
Speaking Security Newsletter | Advisory Note for Organizers and Candidates, n°115 | 20 September 2021

If you find these notes useful, you can support this newsletter here and SPRI, here. Sharing these newsletters also helps. Thank you!
Situation
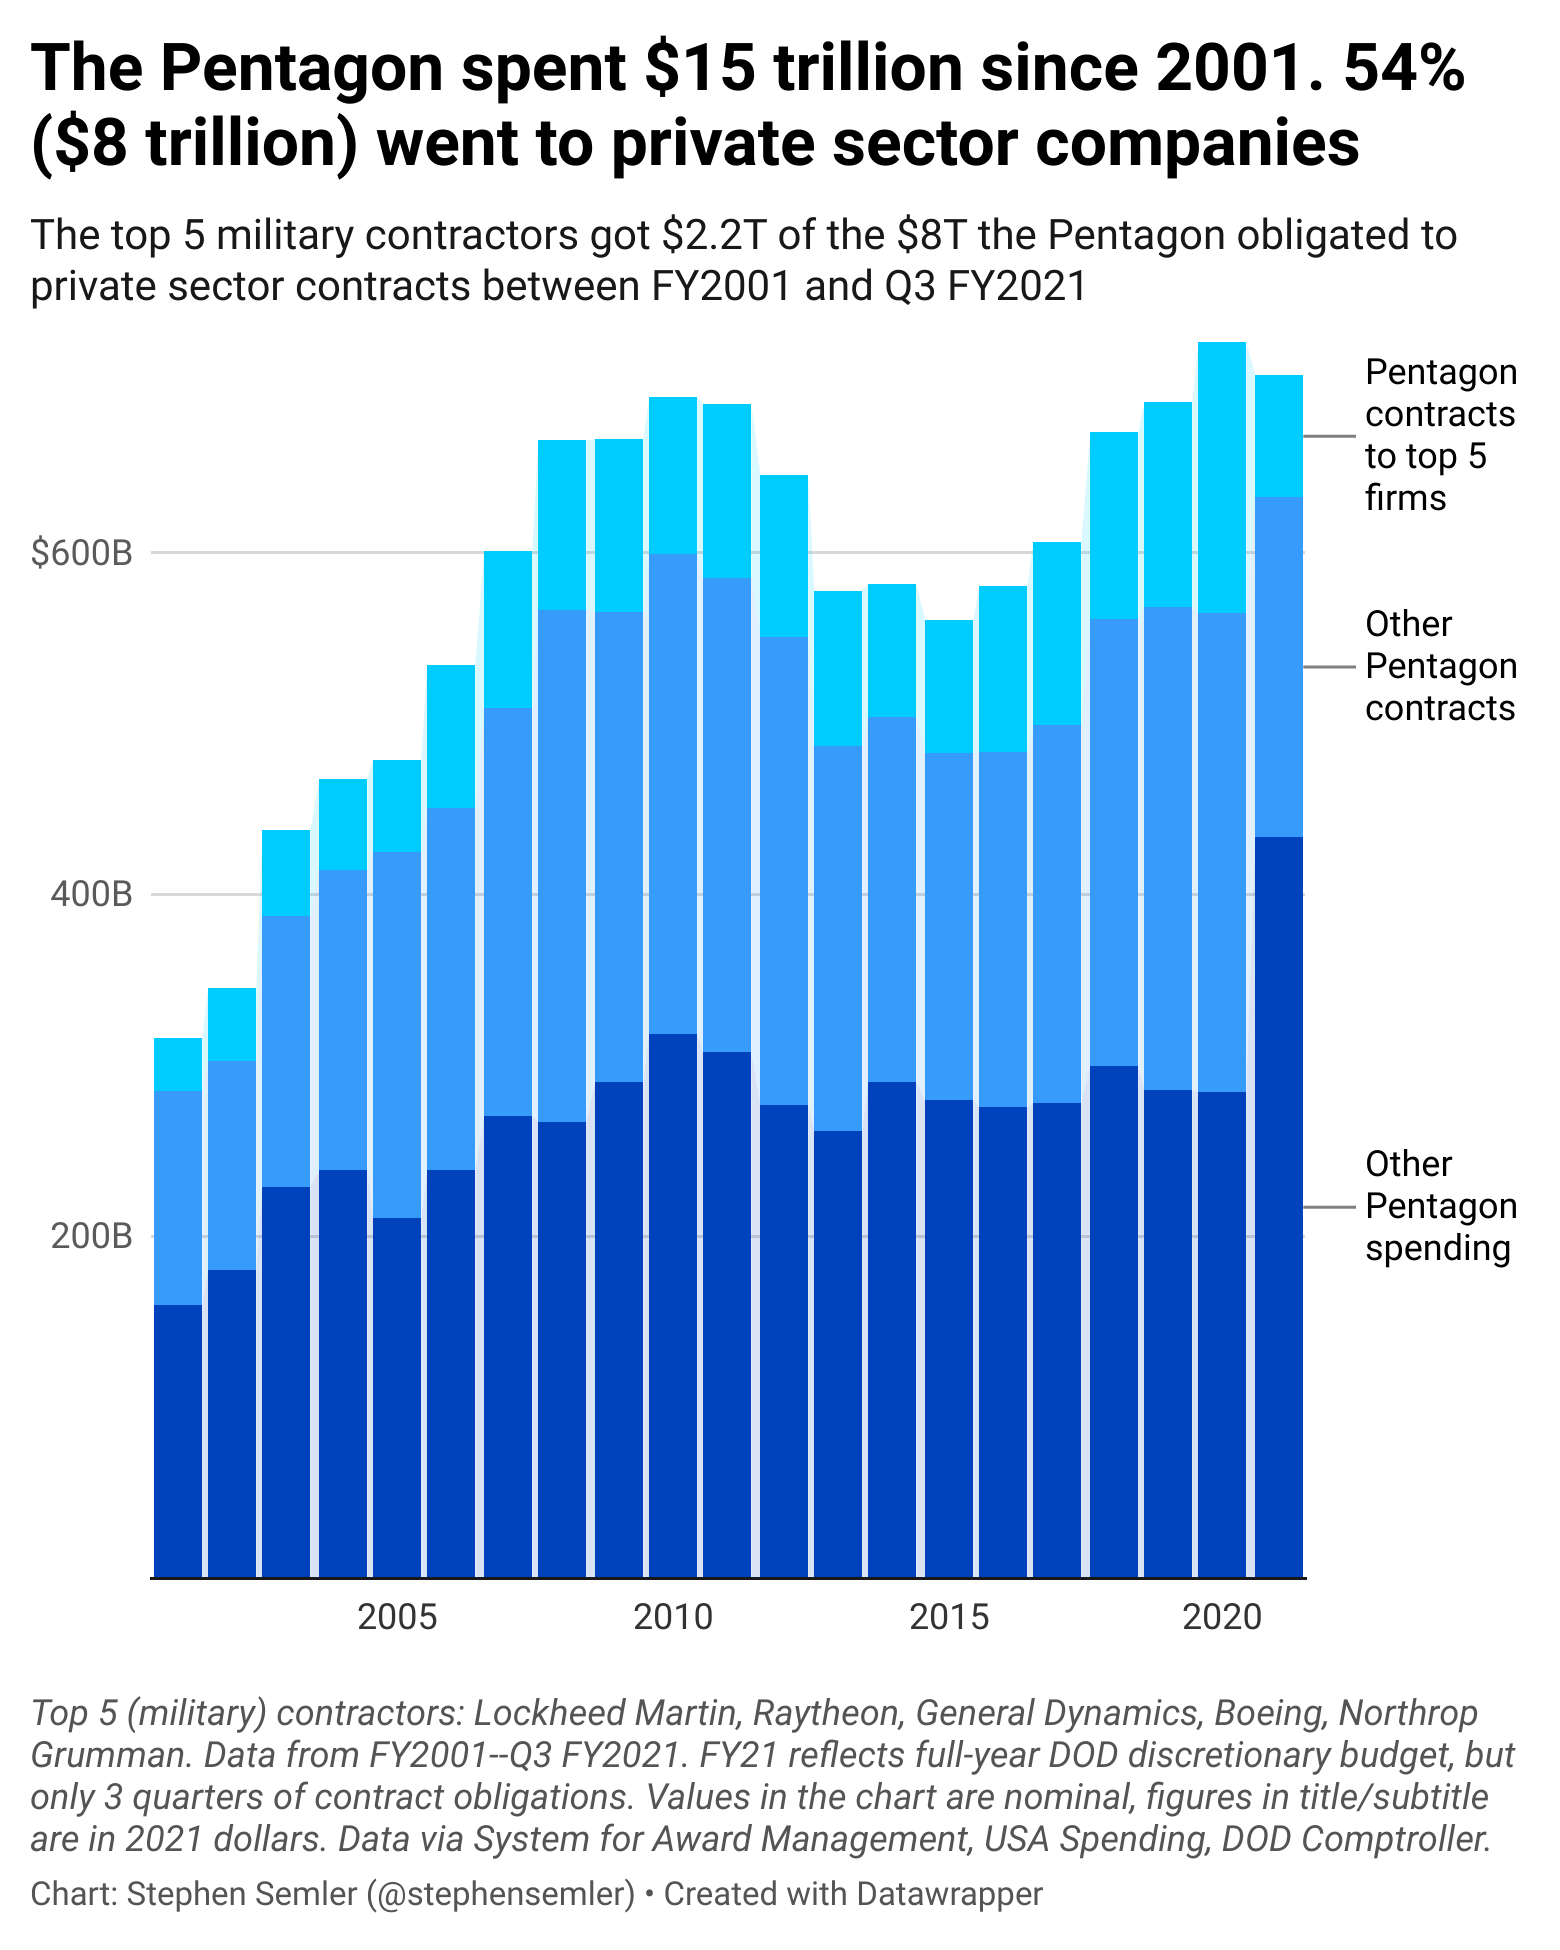
The Costs of War project released a report last week concluding that from fiscal year (FY) 2001-FY2020, the Pentagon spent $14 trillion, “one-third to one-half of which went to defense contractors.”
This estimate seemed too low and unnecessarily broad so I did my own analysis. I found that over half (54%) of the money Congress gave to the Pentagon since FY2001 ended up being passed along to the private sector.
Findings
To the author’s credit, the report’s more precise estimate for the percentage of Department of Defense (DOD) contracts that went to the top 5 firms since FY2001—Lockheed Martin, Raytheon, General Dynamics, Boeing, Northrop Grumman—is pretty much on the money. The author says “one-quarter to one-third”—my analysis shows that it’s 27%.
Methodology
Pentagon spending refers to the Department of Defense (DOD) discretionary budget authority from fiscal year (FY) 2001 through the third quarter (Q3) of FY2021, via the ‘National Defense Budget Estimates for FY2022 (Green Book)’ from the DOD Comptroller. Data is presented nominally in the chart, but is adjusted for inflation for the subtitle and title in the chart as well as the text in this article. Inflation adjustments made according to data by the US Bureau of Labor Statistics (part of the US Department of Labor). Because budget authority and not budget outlays are used in this study, the 54% figure is likely an underestimate. Another reason it is likely to be an underestimate is because the total DOD budget was used for FY2021, while contractor data (for the top5 and not-top 5 firms) doesn’t include Q4 FY2021 data. DOD contract data from FY2001-FY2007 is from the System for Award Management (SAM.gov). DOD contract data for FY2008-3Q FY2021 is from USA Spending (usaspending.gov), accessed 15 September 2021. For DOD contract data for the top 5 military contractors, USA Spending was used for the first three (federal) quarters of FY2021. For FY2001-FY2020, the System for Award Management was used. Specifically, from FY2001-FY2005, SAM’s contractor search feature was cited; for FY2006-FY2020, SAM’s top-contractor reports were cited. Both were controlled to only display contracts funded by the DOD.
-Stephen (@stephensemler; stephen@securityreform.org)
Find this note useful? Please consider becoming a supporter of SPRI. Unlike establishment think tanks, we rely exclusively on small donations.